Showing Account Performance
At the end of each trading day, DriveWealth captures several metrics for each Account.
Performance metrics can be accessed via the Performance Endpoint
Sample Response
GET /back-office/accounts/{accountID}/performance-returns
{
    "accountID": "2345fb7a-8daf-44d7-b813-3840bc985a47.1634583495394",
    "accountNo": "ABCD005972",
    "startDate": "2025-11-11",
    "endDate": "2025-11-18",
    "lastUpdated": "2025-11-18",
    "timeSeries": [
        {
            "date": "2025-11-11",
            "gainLoss": 7.18,
            "positionBalance": 2273.33,
            "cashBalance": 46.38,
            "marketValue": 2319.71,
            "cashFlows": 0.00,
            "deposits": 0.00,
            "withdrawals": 0.00,
            "fees": 0.00,
            "income": 0.00,
            "rateOfReturn": 0.003104
        },
        {
            "date": "2025-11-12",
            "gainLoss": 5.08,
            "positionBalance": 2278.41,
            "cashBalance": 46.38,
            "marketValue": 2324.79,
            "cashFlows": 0.00,
            "deposits": 0.00,
            "withdrawals": 0.00,
            "fees": 0.00,
            "income": 0.00,
            "rateOfReturn": 0.002188
        }...    ],
    "summary": {
        "beginningMarketValue": null,
        "beginningPositionBalance": null,
        "beginningCashBalance": null,
        "endingMarketValue": 2266.53,
        "endingPositionBalance": 2220.15,
        "endingCashBalance": 46.38,
        "periodGainLoss": null,
        "periodCashFlows": 0.00,
        "periodDeposits": 0.00,
        "periodWithdrawals": 0.00,
        "periodFees": 0.00,
        "periodIncome": 0.29,
        "periodReturn": -0.022925,
        "mtdReturn": -0.018631,
        "ytdReturn": 0.120243,
        "inceptionReturn": -0.999999,
        "1yearReturn": 0.092667,
        "3yearReturn": -0.999999,
        "5yearReturn": null
    }
}
Performance Metrics - Definitions
gainLoss- The change in market value of the account during this time series (adjusted to remove impact of cashflows).positionBalance- The sum of the value of the positions held in the account (excluding money market funds which are captured in cashBalance) at the beginning date of the time series. The values for a day are the closing day prices for all asset classes.cashBalance- The total cash balance (settled and unsettled) for this day (see performance.date).marketValue- The market value of the account at the beginning date of the time series. Market value defined as the sum of the position balance and the cash balance.cashFlows- The sum of the inflows and outflows during this time series.deposits: The total amount of deposits calculated from 4pm of the previous day until current time.withdrawals- The total amount of withdrawals calculated from 4pm of the previous day until current time.fees- The total amount of fees calculated from 4pm of the previous day until current time.income- Income in the account for the time series. (Income defined as dividends, interest and capital gains distributions.rateOfReturn- The rate of return for the time series calculated utilizing the Modified Dietz methodology.beginningMarketValue- The market value of the account at the beginning date of the query. Market value defined as the sum of the position balance and the cash balance.beginningPositionBalance- The sum of the value of the positions held in the account (excluding money market funds which are captured in cashBalance) at the beginning date or the query.beginningCashBalance- The cash balance of the account at the beginning date of the query.
endingMarketValue- The market value of the account at the ending date of the query. Market value defined as the sum of the position balance and the cash balance.endingPositionBalance- The sum of the value of the positions held in the account (excluding money market funds which are captured in cashBalance) at the ending date of the queryendingCashBalance- The cash balance of the account at the ending date of the query.periodGainLoss- The gain / loss for the period defined as the delta of thebeginningMarketValuevsendingMarketValueadjusted for cashflows.periodCashFlows- The sum of the inflows and outflows during this period.periodDeposits- The sum of deposits for this period.periodWithdrawals- The sum of withdrawals for this period.periodFees- The sum of trading related fees accumulated during this period.periodIncome- Income in the account for the period. (Income defined as dividends, interest and capital gains distributions.periodReturn- The return for the period calculated by utilizing Modified Dietz methodology.mtdReturn- The month-to-date return for the account calculated utilizing Modified Dietz methodology.ytdReturn- The historic year-to-date year return of the account calculated by joining monthly return statistics. Query will returnNULLvalues if the account has not been open for the duration.1yearReturn- The historic 1 year return of the account calculated by joining monthly return statistics. Query will return NULL values if the account has not been open for the duration.3yearReturn- The historic 3 year return of the account calculated by joining monthly return statistics. Query will return NULL values if the account has not been open for the duration.5yearReturn- The historic 5 year return of the account calculated by joining monthly return statistics. Query will return NULL values if the account has not been open for the duration.inceptionReturn- The historic return of the account calculated by joining monthly return statistics from inception of account to current date.
Building a Graph
DriveWealth supports the ability to chart historic account values and returns through the performance API. Using the various frequencies supported by the performance API, clients can craft a graph to highlight various attributes of a user’s account.
Historic account value
When building a graph to display the value / change in account value over time, it is recommended to use the marketValue field. This represents the ending cash + position balance of the account for that time period.
Gain / Loss of an account
When building a graph to display the value / change in account value over time, it is recommended to use the gainLoss field. This represents the change in value of the account for that time period (after accounting for cash flows).
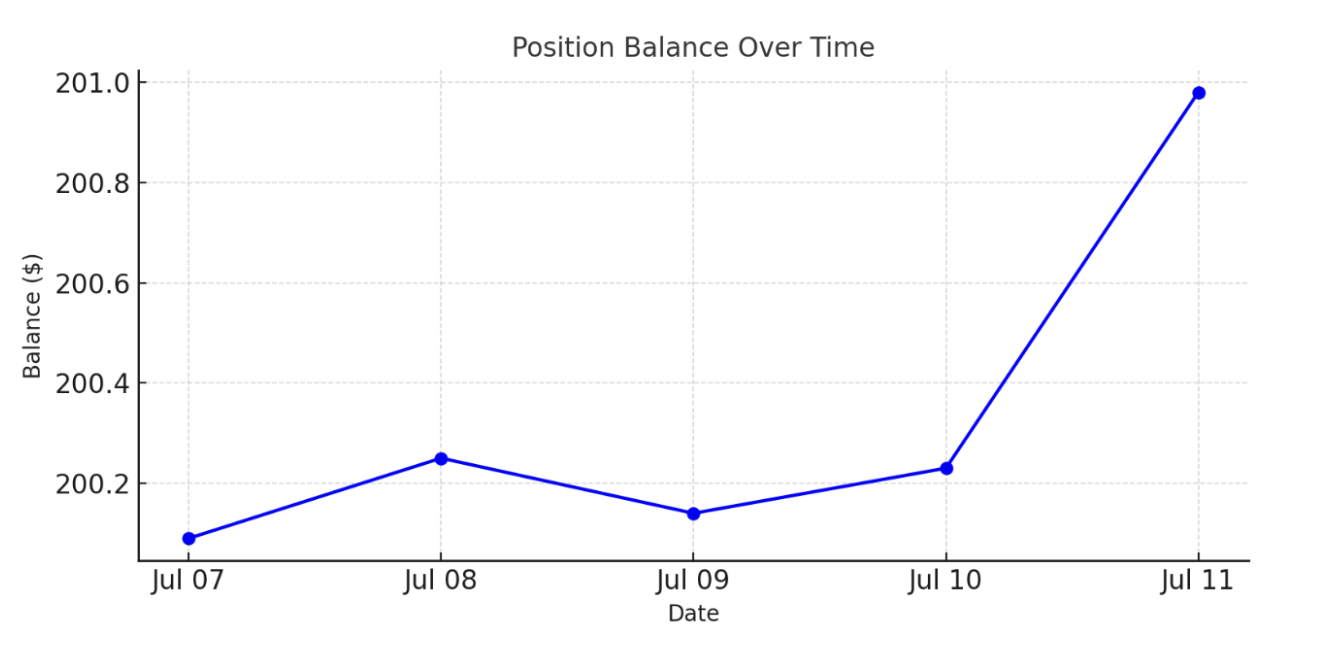
Graph Example for Position Balance Over Time
Sample response for daily returns
...{
           "date": "2024-07-07",
           "gainLoss": 0.00,
           "positionBalance": 200.09,
           "cashBalance": 3016.29,
           "marketValue": 3216.38,
           "cashFlows": 0.00,
           "deposits": 0.00,
           "withdrawals": 0.00,
           "fees": 0.00,
           "income": 0.00,
           "rateOfReturn": 0.000000
       },
       {
           "date": "2024-07-08",
           "gainLoss": 0.16,
           "positionBalance": 200.25,
           "cashBalance": 3016.29,
           "marketValue": 3216.54,
           "cashFlows": 0.00,
           "deposits": 0.00,
           "withdrawals": 0.00,
           "fees": 0.00,
           "income": 0.00,
           "rateOfReturn": 0.000050
       },
       {
           "date": "2024-07-09",
           "gainLoss": -0.11,
           "positionBalance": 200.14,
           "cashBalance": 3016.29,
           "marketValue": 3216.43,
           "cashFlows": 0.00,
           "deposits": 0.00,
           "withdrawals": 0.00,
           "fees": 0.00,
           "income": 0.00,
           "rateOfReturn": -0.000033
       },
       {
           "date": "2024-07-10",
           "gainLoss": 0.09,
           "positionBalance": 200.23,
           "cashBalance": 3016.29,
           "marketValue": 3216.52,
           "cashFlows": 0.00,
           "deposits": 0.00,
           "withdrawals": 0.00,
           "fees": 0.00,
           "income": 0.00,
           "rateOfReturn": 0.000028
       },
       {
           "date": "2024-07-11",
           "gainLoss": 0.75,
           "positionBalance": 200.98,
           "cashBalance": 3016.29,
           "marketValue": 3217.27,
           "cashFlows": 0.00,
           "deposits": 0.00,
           "withdrawals": 0.00,
           "fees": 0.00,
           "income": 0.00,
           "rateOfReturn": 0.000234
       }...
Displaying Performance and Attributes
When displaying a rate of return, the rate of return will typically be displayed as a single figure which corresponds to the time frame of the associated graph. Building on the example above where we plotted the balances over a one week period, we can utilize the rateOfReturn
Performance Example
Display performance return example
- periodReturn for 1 week period = .000277 -> .0277%
"summary": {
       "beginningMarketValue": 3216.38,
       "beginningPositionBalance": 200.09,
       "beginningCashBalance": 3016.29,
       "endingMarketValue": 3217.27,
       "endingPositionBalance": 200.98,
       "endingCashBalance": 3016.29,
       "periodGainLoss": 0.89,
       "periodCashFlows": 0.00,
       "periodDeposits": 0.00,
       "periodWithdrawals": 0.00,
       "periodFees": 0.00,
       "periodIncome": 0.00,
       "periodReturn": 0.000277,
       "mtdReturn": -0.000016,
       "ytdReturn": -0.000016,
       "inceptionReturn": -0.655288,
       "1yearReturn": 0.000018,
       "3yearReturn": -0.191486,
       "5yearReturn": -0.020102
   }
Rate of Return
Modified Dietz
The Modified Dietz Method is a performance measurement technique used in finance to calculate the return on an investment portfolio over a specific period, accounting for external cash flows (deposits or withdrawals). It assumes cash flows occur midway through the period, providing a time-weighted approximation.
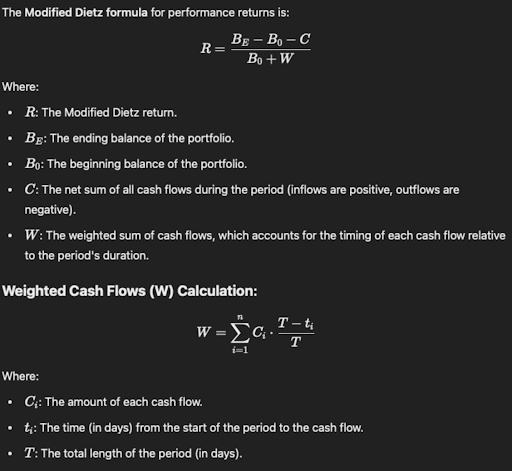
Weighted Cash Flows
W = weighted cash flows for the period
Ci = The i-th cash flow amount.
T = days value - 1 of current date operator (ex: 12/13/2024 | T = 12), this is because the job runs the morning of 13th for the 12th.
ti = The time (in days) from the start of the period to the date of the i-th cash flow. (ex: 12/05/2024 we have a deposit of $100 and 12/09/2024 we have a withdrawal of $50)
Example
ex: 12/05/2024 we have a deposit of $100 and 12/09/2024 we have a withdrawal of $50)
ex: it is the 14th of the month (12/14/2024) (we calc on 13 days)
$100 ((13 - 5 )/ 13) → 100 .61538 = 61.538
-$50 ((13 - 9)/14)) → -50 .307 = 15.384
W = 61.538 + 15.384 = 76.9226
Returns
R = The modified dietz return
Be = ending balance of the portfolio
B0 = beginning balance of the portfolio
C = The net sum of all cash flows during the period (inflows are positive, outflows are negative).
W = The weighted sum of cash flows, which accounts for the timing of each cash flow relative to the period's duration.
Example
ex: our portfolio balance was 10,000 at the beginning of the period, the value is now 10,500
ex: it is the 14th of the month (12/14/2024) (we calc on 13 days)
(10500 - 10000 - (100-50)) / 10000 + 76.9226
450 / 10076.92 → .04465 → 4.465%
Migrating from Performance V1 to Performance V2
Performance V1 Response
{
    "accountID": "2345fb7a-8daf-44d7-b813-3840bc985a47.1634583495394",
    "accountNo": "ABCD005972",
    "startDate": "2025-11-11",
    "endDate": "2025-11-18",
    "lastUpdated": "2025-11-18T17:12:38.935Z",
    "performance": [
        {
            "realizedDayPL": 0,
            "unrealizedDayPL": 7.2,
            "cumRealizedPL": 13.57,
            "date": "2025-11-11",
            "equity": 2273.33,
            "cash": 46.38,
            "deposits": 11.79,
            "withdrawals": 0,
            "fees": 0
        },
        {
            "realizedDayPL": 0,
            "unrealizedDayPL": 5.07,
            "cumRealizedPL": 13.57,
            "date": "2025-11-12",
            "equity": 2278.4,
            "cash": 46.38,
            "deposits": 11.79,
            "withdrawals": 0,
            "fees": 0
        }...
    ]
}
Performance V2 Response
{
    "accountID": "2345fb7a-8daf-44d7-b813-3840bc985a47.1634583495394",
    "accountNo": "ABCD005972",
    "startDate": "2025-11-11",
    "endDate": "2025-11-18",
    "lastUpdated": "2025-11-18",
    "timeSeries": [
        {
            "date": "2025-11-11",
            "gainLoss": 7.18,
            "positionBalance": 2273.33,
            "cashBalance": 46.38,
            "marketValue": 2319.71,
            "cashFlows": 0.00,
            "deposits": 0.00,
            "withdrawals": 0.00,
            "fees": 0.00,
            "income": 0.00,
            "rateOfReturn": 0.003104
        },
        {
            "date": "2025-11-12",
            "gainLoss": 5.08,
            "positionBalance": 2278.41,
            "cashBalance": 46.38,
            "marketValue": 2324.79,
            "cashFlows": 0.00,
            "deposits": 0.00,
            "withdrawals": 0.00,
            "fees": 0.00,
            "income": 0.00,
            "rateOfReturn": 0.002188
        }...    ],
    "summary": {
        "beginningMarketValue": null,
        "beginningPositionBalance": null,
        "beginningCashBalance": null,
        "endingMarketValue": 2266.53,
        "endingPositionBalance": 2220.15,
        "endingCashBalance": 46.38,
        "periodGainLoss": null,
        "periodCashFlows": 0.00,
        "periodDeposits": 0.00,
        "periodWithdrawals": 0.00,
        "periodFees": 0.00,
        "periodIncome": 0.29,
        "periodReturn": -0.022925,
        "mtdReturn": -0.018631,
        "ytdReturn": 0.120243,
        "inceptionReturn": -0.999999,
        "1yearReturn": 0.092667,
        "3yearReturn": -0.999999,
        "5yearReturn": null
    }
}
V1 fields and status vs V2
- realizedDayPL -> not supported
- unrealizedDayPL -> not supported
- cumRealizedPL -> not supported
- date -> supported (V2->
date) - equity -> supported (V2 ->
positionsBalance) - cash -> supported (V2 ->
cashFlows) - deposits -> supported (V2 ->
deposits) - withdrawals -> supported (V2 ->
withdrawals) - fees -> supported (V2 ->
fees)
API Considerations
API Validations
- User must pass
frequency,from, andto
If any are omitted, API will return an error - If delta between from and to is less than 3 months (90 days, 13 weeks, 3 months)
Valid values for period areD,W,M - If delta between from and to is > 3 months and less than 12 months
Valid values for period areM - If delta between from and to is > 12 months
Valid values for period areM,Y
API Behavior
mtdReturn, ytdReturn, 1yearReturn, 3yearReturn, 5yearReturn, inceptionReturn will return null if values are not available for these time periods when returning a 200 response
Daily Returns
When requesting daily returns, the overall time period’s figures will be returned at the root level and each day’s values will be returned in the array. (ex: from = 2019-08-24 | To = 2019-08-26 | period = D
Weekly Returns
"Defined as Monday to Friday."
When requesting weekly returns, the overall time period’s figures will be returned at the root level and each week’s values will be returned in the array. (ex: from = 2025-04-03 | To = 2025-04-08 | period = W
*Note: for weekly returns, we return the values from Monday to Friday. ex: if a user requests a Wednesday date in the From field, we will adjust this to the date of the Monday of that week and if the user requests a Wednesday in the To field, we will adjust this to the date of the Friday of that week. The date returned in the array will always be the Friday date
Monthly Returns
"Defined as first of the month to the last of the month."
When requesting monthly returns, the overall time period’s figures will be returned at the root level and each month’s values will be returned in the array. (ex: from = 2025-01-05 | To = 2025-02-10 | period = M
*Note: for monthly returns, do not utilize the day value in the To | From input. ex: if a user requests a 2025-01-05 date in the From field and the user requests 2025-02-10 in the To field, we will calculate monthly returns in January and February. The startDate will be 2025-01-01 and the end date will be 2025-02-28. The array will return 2 records (2025-01-31 and 2025-02-28)
Yearly Returns
"Defined as first of the year to last of the year."
When requesting yearly returns, the overall time period’s figures will be returned at the root level and each year’s values will be returned in the array. (ex: from = 2024-01-05 | To = 2025-02-10 | period = Y
*Note: for yearly returns, do not utilize the day or month values in the To | From input. ex: if a user requests 2024-01-05 date in the From field and the user requests 2025-02-10 in the To field, we will calculate yearly returns for 2024 and 2025 YTD. The startDate will be 2024-01-01 and the end date will be the last calculated performance date (ex: we run on 2025-04-08 midday, the last day will be 2025-04-07). The array will return 2 records (2025-01-31 and 2025-04-07)
Updated 11 days ago